Data study · living tracker
The Coffee Inflation Tracker
By Paul Tanswell · Updated 2026-10-05 · refreshed monthly
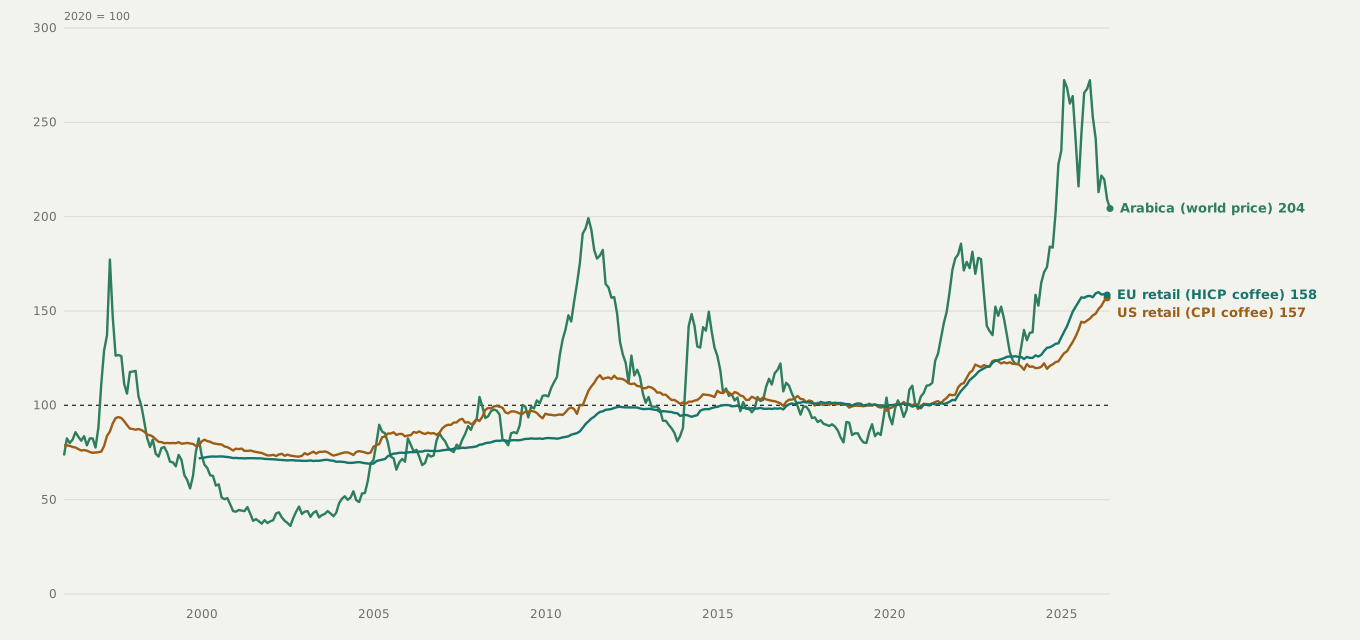
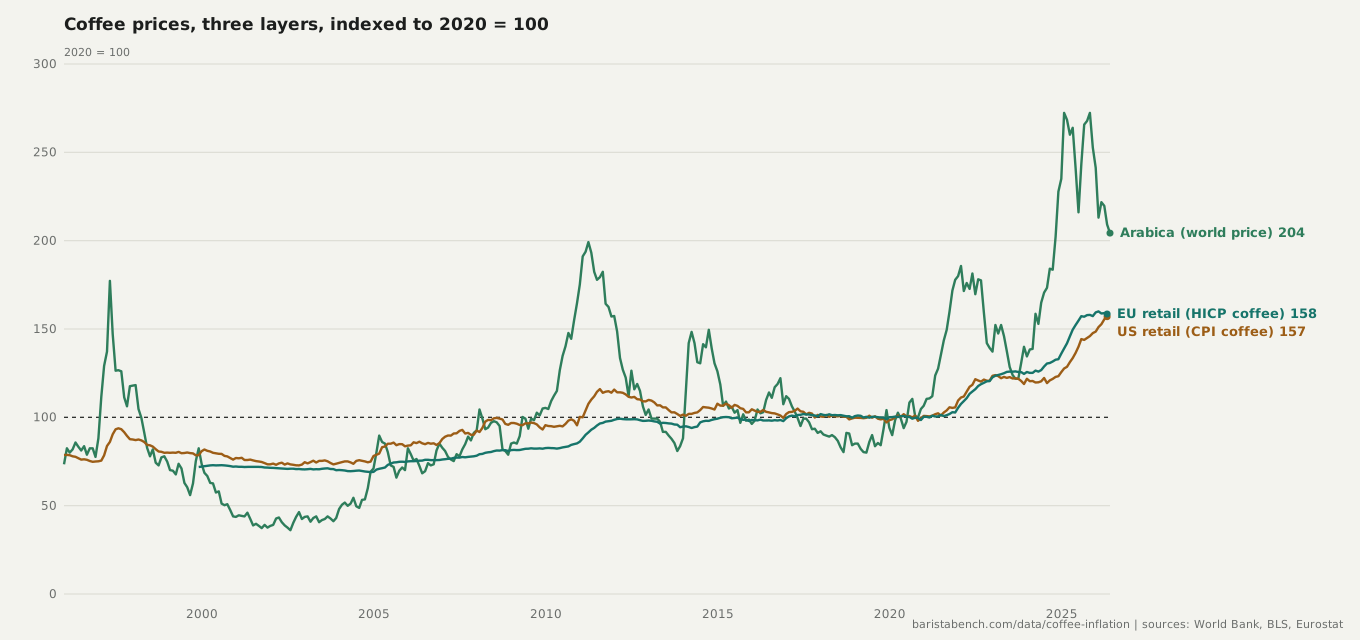
Three prices make up your cup: what the beans cost on the world market, what the bag costs on the shelf, and what the barista charges. This tracker follows all three across three decades and 36 countries, from the World Bank, the US Bureau of Labor Statistics and Eurostat. No estimates and no survey vibes, just the primary series, indexed so they can be read side by side.
The finding
US retail coffee is up 53% since 2020, against 29% overall inflation. The shelf price follows the commodity about 4 months later, and it follows asymmetrically: while arabica is rising, a 10% commodity move drags retail up about 3.6%; while arabica is falling, a 10% drop pulls retail down only about 1.5%. Europe is slower and more lopsided still (8 month lag, asymmetry ratio 4.42 vs 2.44 in the US). The pattern is consistent with the old suspicion: your cup keeps the inflation and skips most of the deflation.
The number on the shelf
A pound of ground roast averaged $9.3 in US cities in August 2026. Across 2020 it averaged $4.43. That is a 110% rise in about six years, 24 points more than general US inflation over the same stretch. Arabica itself traded at $7.26/kg in September 2026.
The ratchet, cycle by cycle
Every major arabica swing since 1990, and what US shelf prices did in the same window shifted by the 4 month pass-through lag. The give-back column is the tell: after a commodity crash, how much of the retail climb that preceded it was actually surrendered. Short crashes returned roughly a third. Only the long bear markets gave it all back, and each took half a decade.
| Commodity window | Arabica | US retail | Given back |
|---|---|---|---|
| 1992-08 to 1994-08 | +291% | +64% | · |
| 1994-08 to 1996-01 | -47% | -13% | 33% |
| 1996-01 to 1997-05 | +104% | +20% | · |
| 1997-05 to 2002-07 | -76% | -22% | 131% |
| 2002-07 to 2011-04 | +421% | +59% | · |
| 2011-04 to 2013-11 | -57% | -12% | 32% |
| 2013-11 to 2014-04 | +73% | +4% | · |
| 2014-04 to 2019-04 | -44% | -5% | 135% |
| 2019-04 to 2025-10 | +232% | +50% | · |
The current cycle (bottom row) has no crash yet, so nothing has been given back. Method: zigzag turning points at 35% reversal on smoothed arabica; details in the methodology.
Coffee inflation by country, since 2020
Ranked by how much coffee has outrun each country's own overall inflation, which is the fair comparison: raw coffee inflation rankings are dominated by economies where everything inflated. Sweden leads, and the Nordics fill much of the podium despite mild general inflation. Numbers are HICP coffee (Eurostat) and CPI coffee (BLS) through the latest published month.
| # | Country | Coffee | All items | Coffee vs basket | Worst 12 months |
|---|---|---|---|---|---|
| 1 | Sweden | +91% | +24% | +55% | +47% (May 2025) |
| 2 | Finland | +84% | +20% | +53% | +52% (March 2022) |
| 3 | Türkiye | +1279% | +814% | +51% | +152% (January 1998) |
| 4 | Denmark | +71% | +21% | +42% | +33% (June 2011) |
| 5 | Latvia | +97% | +44% | +37% | +36% (September 2022) |
| 6 | Serbia | +96% | +48% | +33% | +31% (July 2011) |
| 7 | North Macedonia | +93% | +46% | +33% | +36% (September 2025) |
| 8 | Slovenia | +72% | +30% | +32% | +33% (July 2025) |
| 9 | Iceland | +76% | +38% | +27% | +24% (October 2025) |
| 10 | Bulgaria | +80% | +42% | +27% | +220% (December 1997) |
| 11 | Estonia | +90% | +53% | +24% | +58% (August 2011) |
| 12 | Croatia | +74% | +41% | +23% | +26% (November 2022) |
| 13 | Cyprus | +55% | +27% | +23% | +23% (December 2022) |
| 14 | Austria | +62% | +32% | +23% | +30% (August 2011) |
| 15 | Kosovo* | +69% | +38% | +23% | +22% (June 2022) |
| 16 | France | +49% | +22% | +22% | +18% (September 2025) |
| 17 | Italy | +50% | +24% | +21% | +25% (May 2025) |
| 18 | Romania | +89% | +57% | +21% | +26% (February 2026) |
| 19 | United States | +53% | +29% | +18% | +59% (November 1994) |
| 20 | Montenegro | +70% | +44% | +18% | +26% (March 2025) |
| 21 | Hungary | +84% | +57% | +17% | +44% (April 2023) |
| 22 | Netherlands | +54% | +32% | +17% | +26% (July 2025) |
| 23 | Malta | +44% | +26% | +15% | +20% (March 2023) |
| 24 | Greece | +45% | +26% | +14% | +21% (December 2025) |
| 25 | Luxembourg | +45% | +27% | +14% | +19% (March 1998) |
| 26 | Spain | +46% | +28% | +14% | +21% (August 2025) |
| 27 | Germany | +47% | +29% | +14% | +23% (August 2025) |
| 28 | Slovakia | +61% | +43% | +13% | +30% (December 2025) |
| 29 | Poland | +65% | +47% | +13% | +23% (December 2022) |
| 30 | Belgium | +47% | +31% | +12% | +33% (December 1997) |
| 31 | Czechia | +59% | +43% | +12% | +30% (July 2025) |
| 32 | Lithuania | +62% | +49% | +9% | +46% (August 2011) |
| 33 | Portugal | +32% | +25% | +5% | +14% (July 2025) |
| 34 | Ireland | +32% | +25% | +5% | +16% (April 1998) |
| 35 | Switzerland | +12% | +8% | +3% | +10% (August 2022) |
| 36 | Albania | +24% | +24% | +0% | +9% (August 2022) |
Türkiye's raw coffee number is enormous but so is its general inflation; the coffee vs basket column is the honest ranking.
And at the counter: the cappuccino snapshot
Cafe prices have no official statistic, so this layer starts here: a monthly archived snapshot of Numbeo's crowd-sourced cappuccino price across 99 countries, first captured October 2026. Each run adds a column to a series nobody else is keeping. Crowd-sourced means indicative, not official; we label it and track it anyway, openly.
Dearest
| Denmark | $6.52 |
| Switzerland | $6.16 |
| United States | $5.48 |
| Qatar | $5.47 |
| Norway | $5.46 |
Cheapest
| Algeria | $0.81 |
| Tunisia | $0.99 |
| Iran | $1.20 |
| Nepal | $1.39 |
| Ukraine | $1.49 |
Questions people actually ask
Why is coffee so expensive right now?
The commodity did it. Arabica traded at $7.26/kg in September 2026, roughly double its 2020 level, after weather-hit harvests in Brazil and Vietnam. US retail follows the commodity with a lag of about 4 months, and a bag of ground roast averaged $9.3/lb in August 2026 against $4.43/lb across 2020.
Will coffee prices come back down?
History says: slowly, and not all the way. In the two short commodity crashes since 1990, US shelf prices gave back only about a third of the rise that preceded them. Only the long multi-year bear markets of 1997 to 2002 and 2014 to 2019 eventually undid the whole climb. On the one-to-three year horizon retail falls measurably less than it rises: a 10% arabica rise is followed by roughly a 3.6% retail rise, a 10% fall by roughly a 1.5% retail fall.
Where has coffee outpaced inflation the most?
Sweden. Coffee there is up 91% since 2020 against 24% general inflation, which makes coffee about 55% dearer relative to everything else in the basket. The mildest case in Europe is Switzerland at 12% since 2020.
How we did this
Commodity prices from the World Bank's monthly Pink Sheet, US retail from BLS (average price and CPI series), European retail from Eurostat HICP at item level, deflators and FX from the same institutions. Everything is indexed to 2020 = 100, missing data is excluded rather than estimated, and the pass-through and asymmetry numbers describe co-movement, not proof of anyone's pricing strategy. Every judgment call is in the full methodology. Fact-checking a number? Email hello@baristabench.com. We answer.
Download the indexed dataset (CSV), the country table (CSV) or the chart graphic. Free to publish with attribution and a link to this page.
Cite this page
Barista Bench, "The Coffee Inflation Tracker", updated 2026-10-05. https://baristabench.com/data/coffee-inflation