Data study
The best and worst tap water cities for espresso
By Paul Tanswell · Published July 9, 2026 · Utility reports 2024 to 2025 · Refreshed annually
Every espresso machine manual says use filtered water. Nobody maps where the tap actually ruins the cup, or the machine. So we did: the 100 largest US cities, measured against the Specialty Coffee Association's water standard, using each city utility's own published water quality data. No estimates, no third-party databases; if a utility does not publish a number, that city is excluded and we say so.
The finding
Of the 81 big cities whose utilities publish a hardness figure, 68 fall outside the Specialty Coffee Association's ideal range. That is roughly 44 million Americans brewing on water the specialty world considers out of spec: water that measurably changes how espresso extracts, and on the hard end shortens a machine's life. The spread is enormous: Portland at 9 ppm to Madison at 325 ppm, a 36x difference in the same country.
Key findings
- 68 of the 81 largest US cities with a published hardness figure have tap water outside the Specialty Coffee Association's ideal range for espresso, which covers roughly 44 million people.
- The hardest big-city tap water in the study is Madison at 325 ppm total hardness and the softest is Portland at 9 ppm, a 36x spread inside one country.
- Memphis has the best-scoring tap water for espresso of the 66 cities with enough published data for a full score, at 93.9 of 100, and San Jose scores lowest at 4.3.
- Limescale forms from carbonate hardness, the fraction of hardness that drops out of solution when water is heated. Measured on that, a home espresso machine pulling two double shots a day wants descaling roughly every 5 weeks in Madison and only about once a year in 8 of the cities, including New York, Charlotte, Seattle.
- Only 27 of the 81 cities with a computable interval fall inside the every one to three months descaling schedule that manufacturers and most guides publish; 54 need it less often than that.
- Every figure comes from the city utility's own published water quality report for 2021 or later. Nothing is estimated, interpolated or filled from a third-party database, and a city without a published number is excluded and listed as such.
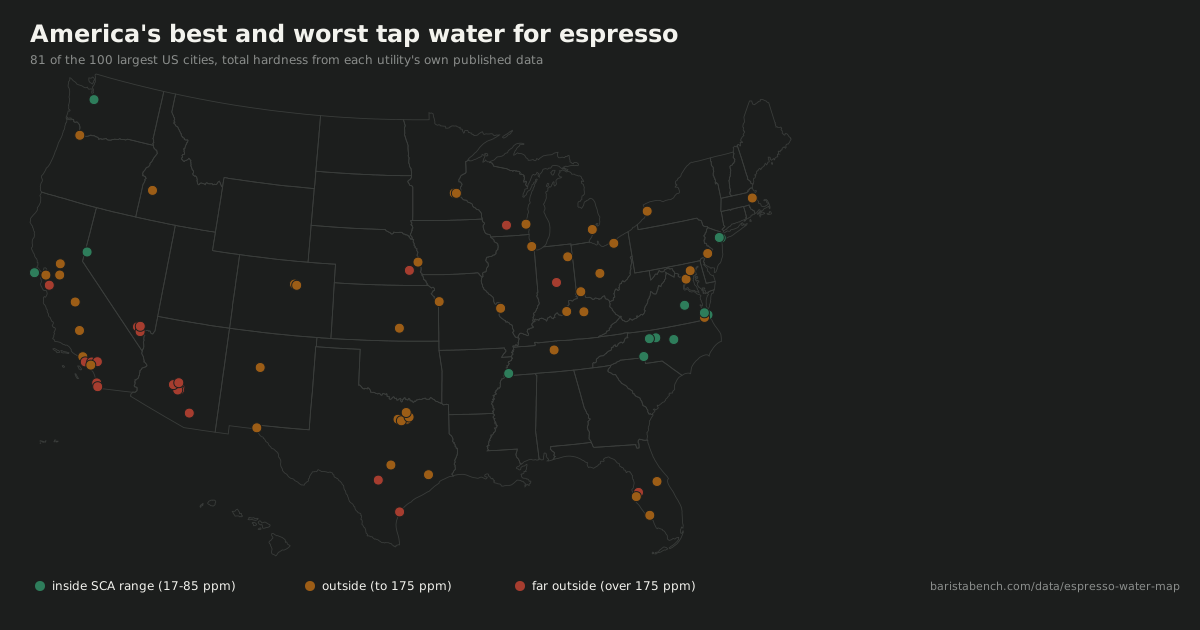
softer than range (under 17 ppm)inside SCA range (17-85 ppm)harder (to 175 ppm)far harder (over 175 ppm)
Espresso Eden: the best 10
| # | City | Score | Hardness | Descale every |
|---|---|---|---|---|
| 1 | Memphis, Tennessee | 93.9 | 46 ppm | 35 wks |
| 2 | Norfolk, Virginia | 93.4 | 48 ppm | 37 wks |
| 3 | Virginia Beach, Virginia | 93.4 | 56 ppm | 37 wks |
| 4 | Richmond, Virginia | 90.5 | 81 ppm | 31 wks |
| 5 | Greensboro, North Carolina | 89.6 | 41 ppm | 52 wks |
| 6 | Chesapeake, Virginia | 88.9 | 16 ppm | 52 wks |
| 7 | Boston, Massachusetts | 88.6 | 16 ppm | 52 wks |
| 8 | Jersey City, New Jersey | 85.9 | 81 ppm | 31 wks |
| 9 | New York, New York | 85.8 | 25 ppm | 52 wks |
| 10 | Philadelphia, Pennsylvania | 85.1 | 98 ppm | 39 wks |
Scale City: the worst 10
| # | City | Score | Hardness | Descale every |
|---|---|---|---|---|
| 66 | San Jose, California | 4.3 | 314 ppm | 5 wks |
| 65 | Indianapolis, Indiana | 13.1 | 317 ppm | 5 wks |
| 64 | Anaheim, California | 21.4 | 318 ppm | 9 wks |
| 63 | Chula Vista, California | 22.6 | 193 ppm | 11 wks |
| 62 | Corpus Christi, Texas | 23.3 | 226 ppm | 13 wks |
| 61 | Phoenix, Arizona | 23.7 | 251 ppm | 9 wks |
| 60 | Mesa, Arizona | 24.9 | 226 ppm | 7 wks |
| 59 | Long Beach, California | 26.0 | 185 ppm | 14 wks |
| 58 | San Diego, California | 26.3 | 216 ppm | 14 wks |
| 57 | Tucson, Arizona | 26.5 | 209 ppm | 8 wks |
Is your city on the list?
All 100 cities, ordered by score rank; cities with a hardness figure but no full score follow (soft to hard), and the cities whose utilities publish no data close the list. 66 have enough published parameters for a full Espresso Water Score; 81 have a verified hardness figure. A dot means the utility does not publish that value (we never estimate; the methodology lists every exclusion).
| Score rank | City | Score | Hardness ppm | Alkalinity | pH | TDS | Descale every |
|---|---|---|---|---|---|---|---|
| 1 | Memphis, Tennessee | 93.9 | 46 | 53 | 7.1 | · | 35 wks |
| 2 | Norfolk, Virginia | 93.4 | 48 | 43 | 7.6 | 125 | 37 wks |
| 3 | Virginia Beach, Virginia | 93.4 | 56 | 43 | 7.6 | 127 | 37 wks |
| 4 | Richmond, Virginia | 90.5 | 81 | 52 | 7.8 | 149 | 31 wks |
| 5 | Greensboro, North Carolina | 89.6 | 41 | 31 | 7.6 | 93 | 52 wks |
| 6 | Chesapeake, Virginia | 88.9 | 16 | · | 7.7 | · | 52 wks |
| 7 | Boston, Massachusetts | 88.6 | 16 | 40 | 9.4 | 97 | 52 wks |
| 8 | Jersey City, New Jersey | 85.9 | 81 | 53 | 7.5 | 272 | 31 wks |
| 9 | New York, New York | 85.8 | 25 | 22 | 7.3 | 66 | 52 wks |
| 10 | Philadelphia, Pennsylvania | 85.1 | 98 | 41 | 7.2 | 223 | 39 wks |
| 11 | Winston-Salem, North Carolina | 85.0 | 18 | 24 | 7.5 | · | 52 wks |
| 12 | Detroit, Michigan | 84.1 | 107 | 71 | 7.2 | 112 | 23 wks |
| 13 | San Francisco, California | 82.7 | 62 | 64 | 9.3 | 95 | 26 wks |
| 14 | Columbus, Ohio | 80.1 | 102 | 55 | 7.8 | · | 29 wks |
| 15 | Minneapolis, Minnesota | 78.2 | 99 | 65 | 9.1 | 169 | 25 wks |
| 16 | Denver, Colorado | 77.0 | 105 | 65 | 8.8 | 158 | 25 wks |
| 17 | Baltimore, Maryland | 76.8 | 110 | 62 | 7.9 | 210 | 26 wks |
| 18 | Seattle, Washington | 76.3 | 24 | 20 | 8.3 | 41 | 52 wks |
| 19 | Charlotte, North Carolina | 76.0 | 32 | 21 | 8.6 | 59 | 52 wks |
| 20 | Arlington, Texas | 75.6 | 92 | 82 | 8.0 | 209 | 20 wks |
| 21 | St. Paul, Minnesota | 74.4 | 98 | 54 | 9.2 | · | 30 wks |
| 22 | Anchorage, Alaska | 74.0 | 107 | 82 | 7.8 | 170 | 20 wks |
| 23 | Louisville/Jefferson County, Kentucky | 73.8 | 115 | 63 | 8.7 | 213 | 25 wks |
| 24 | Cleveland, Ohio | 73.4 | 117 | 82 | 7.3 | 180 | 20 wks |
| 25 | Oakland, California | 73.3 | 87 | 80 | 8.8 | 65 | 20 wks |
| 26 | Raleigh, North Carolina | 73.0 | 25 | 24 | 8.4 | · | 52 wks |
| 27 | St. Louis, Missouri | 69.6 | 129 | 55 | 9.5 | 298 | 29 wks |
| 28 | Bakersfield, California | 68.2 | 105 | 91 | 7.7 | 219 | 18 wks |
| 29 | Houston, Texas | 67.7 | 110 | · | 8.0 | 230 | 15 wks |
| 30 | Lexington-Fayette, Kentucky | 67.5 | 161 | 77 | 7.5 | 168 | 21 wks |
| 31 | Buffalo, New York | 66.5 | 95 | 95 | 7.7 | 164 | 17 wks |
| 32 | Cincinnati, Ohio | 63.5 | 126 | 80 | 8.8 | 213 | 20 wks |
| 33 | Boise City, Idaho | 62.7 | 105 | 123 | 7.3 | 200 | 15 wks |
| 34 | Wichita, Kansas | 58.6 | 130 | 41 | 8.5 | 540 | 39 wks |
| 35 | Aurora, Colorado | 58.3 | 136 | 85 | 8.1 | 240 | 19 wks |
| 36 | Los Angeles, California | 57.2 | 112 | 112 | 7.7 | 252 | 14 wks |
| 37 | Milwaukee, Wisconsin | 56.7 | 137 | · | · | 173 | 12 wks |
| 38 | Albuquerque, New Mexico | 56.5 | 118 | 104 | 7.5 | 298 | 16 wks |
| 39 | Chicago, Illinois | 50.9 | 142 | 100 | 7.8 | 177 | 16 wks |
| 40 | Fort Worth, Texas | 49.6 | 129 | 112 | 8.2 | 213 | 14 wks |
| 41 | El Paso, Texas | 49.4 | 175 | 79 | 7.7 | 658 | 20 wks |
| 42 | Irvine, California | 45.7 | 128 | 101 | 8.3 | 289 | 16 wks |
| 43 | Frisco, Texas | 44.3 | 148 | 91 | 8.1 | 319 | 18 wks |
| 44 | Sacramento, California | 42.0 | 138 | 132 | · | 276 | 12 wks |
| 45 | Stockton, California | 38.1 | 150 | 171 | 8.0 | 294 | 11 wks |
| 46 | Kansas City, Missouri | 36.7 | 140 | 216 | 10.1 | 309 | 11 wks |
| 47 | Lincoln, Nebraska | 34.9 | 192 | 164 | 7.8 | 329 | 10 wks |
| 48 | Garland, Texas | 34.9 | 142 | 104 | 8.1 | 381 | 15 wks |
| 49 | Riverside, California | 34.1 | 194 | 161 | 7.8 | 350 | 10 wks |
| 50 | Scottsdale, Arizona | 34.0 | 253 | 124 | 7.5 | 518 | 13 wks |
| 51 | Omaha, Nebraska | 32.6 | 154 | 112 | 9.0 | 396 | 14 wks |
| 52 | Chandler, Arizona | 31.6 | 231 | 140 | 7.7 | · | 12 wks |
| 53 | North Las Vegas, Nevada | 31.3 | 280 | 112 | 7.8 | 582 | 14 wks |
| 54 | Gilbert, Arizona | 29.1 | 184 | 135 | 7.8 | 801 | 12 wks |
| 55 | Glendale, Arizona | 27.0 | 229 | 138 | 7.9 | 522 | 12 wks |
| 56 | St. Petersburg, Florida | 26.9 | 165 | 125 | 8.2 | · | 13 wks |
| 57 | Tucson, Arizona | 26.5 | 209 | · | 7.5 | 485 | 8 wks |
| 58 | San Diego, California | 26.3 | 216 | 116 | 8.3 | 479 | 14 wks |
| 59 | Long Beach, California | 26.0 | 185 | 112 | 8.4 | 475 | 14 wks |
| 60 | Mesa, Arizona | 24.9 | 226 | · | 7.4 | 580 | 7 wks |
| 61 | Phoenix, Arizona | 23.7 | 251 | 175 | 7.8 | 623 | 9 wks |
| 62 | Corpus Christi, Texas | 23.3 | 226 | 125 | · | 516 | 13 wks |
| 63 | Chula Vista, California | 22.6 | 193 | 151 | 8.2 | 533 | 11 wks |
| 64 | Anaheim, California | 21.4 | 318 | 180 | 7.9 | 550 | 9 wks |
| 65 | Indianapolis, Indiana | 13.1 | 317 | · | 7.7 | · | 5 wks |
| 66 | San Jose, California | 4.3 | 314 | · | · | 403 | 5 wks |
| · | Portland, Oregon | · | 9 | · | 8.5 | · | 52 wks |
| · | Reno, Nevada | · | 54 | · | 7.8 | · | 30 wks |
| · | Fresno, California | · | 89 | · | · | 176 | 18 wks |
| · | Nashville-Davidson, Tennessee | · | 101 | · | · | · | 16 wks |
| · | Cape Coral, Florida | · | 103 | · | · | · | 16 wks |
| · | Austin, Texas | · | 114 | · | · | · | 14 wks |
| · | Fort Wayne, Indiana | · | 122 | · | · | · | 13 wks |
| · | Orlando, Florida | · | 129 | · | · | · | 12 wks |
| · | Dallas, Texas | · | 138 | · | · | · | 12 wks |
| · | Washington, District of Columbia | · | 139 | · | · | · | 12 wks |
| · | Tampa, Florida | · | 211 | · | 7.9 | · | 8 wks |
| · | Henderson, Nevada | · | 267 | · | · | · | 6 wks |
| · | Las Vegas, Nevada | · | 280 | · | · | · | 6 wks |
| · | San Antonio, Texas | · | 300 | · | · | · | 5 wks |
| · | Madison, Wisconsin | · | 325 | · | · | · | 5 wks |
| · | Atlanta, Georgia | · | · | · | · | · | · |
| · | Colorado Springs, Colorado | · | · | · | · | · | · |
| · | Durham, North Carolina | · | · | · | 7.5 | · | · |
| · | Hialeah, Florida | · | · | · | · | · | · |
| · | Irving, Texas | · | · | · | · | · | · |
| · | Jacksonville, Florida | · | · | · | · | 864 | · |
| · | Laredo, Texas | · | · | · | 7.2 | · | · |
| · | Lubbock, Texas | · | · | · | · | · | · |
| · | Miami, Florida | · | · | · | · | · | · |
| · | New Orleans, Louisiana | · | · | · | · | · | · |
| · | Newark, New Jersey | · | · | · | · | · | · |
| · | Oklahoma City, Oklahoma | · | · | · | · | · | · |
| · | Pittsburgh, Pennsylvania | · | · | · | · | · | · |
| · | Plano, Texas | · | · | · | · | · | · |
| · | Port St. Lucie, Florida | · | · | · | · | · | · |
| · | Santa Ana, California | · | · | · | · | · | · |
| · | Toledo, Ohio | · | · | · | · | · | · |
| · | Tulsa, Oklahoma | · | · | · | · | · | · |
| · | Urban Honolulu CDP, Hawaii | · | · | · | 7.5 | · | · |
Reading the table
- Score
- The Espresso Water Score, 0 to 100: how close the city's water sits to the SCA brew-water targets, with hardness and alkalinity weighted highest. The methodology has the full rubric.
- Hardness ppm
- Dissolved calcium and magnesium, in parts per million as calcium carbonate. The mineral load that does the extracting, and the scale former that kills machines. SCA ideal: 17 to 85 ppm.
- Alkalinity
- The water's acid-buffering capacity, in ppm as calcium carbonate. Too much buffers away the acidity you paid for in good beans. SCA target: near 40.
- pH
- How acidic or basic the water itself is; 7 is neutral. SCA range: 6.5 to 7.5.
- TDS
- Total dissolved solids: everything dissolved in the water, minerals and salts together, in ppm. SCA range: 75 to 250.
- Descale every
- Our indicative descaling interval for a home machine pulling two double shots a day on that city's water. Built to compare cities, not to override your machine's manual.
What this means for your machine
Scale is carbonate hardness cooking out of the water at boiler temperature. The harder your water, the faster it coats heating elements and clogs valves. Our Machine Mortality Score translates each city's carbonate hardness into an indicative descaling interval for a home machine pulling two doubles a day: in the hardest cities that is every four to six weeks, against six months or more in the softest. If you live on the wrong end of the map, descaling is not optional maintenance, it is the difference between a machine that lasts and one that dies young. Our descaling guide covers the safe routine.
What this means for taste
The SCA's targets exist because minerals do the extracting. Too soft and espresso tastes hollow and sour; too hard and it goes flat and chalky, with alkalinity buffering away the acidity you paid for in good beans. Cities inside the range can brew great coffee straight from the tap. Outside it, a simple filter jug (hard water) or a mineral additive (very soft water) moves you most of the way back.
How we did this
City list from the Census Bureau's 2024 population estimates. Water values from each utility's own published reports and official water quality pages, extracted with a verbatim quote per number and machine-verified against the source document. Missing data means exclusion, never estimation. Scoring measures distance from the SCA water standard, with hardness and alkalinity weighted highest. Every judgment call is in the full methodology. Fact-checking a number? Email hello@baristabench.com. We answer.
Download the full dataset (CSV) with each city's report link and year, the per-value source quotes (CSV), or grab the map graphic. All are free to publish with attribution and a link to this page. This study refreshes annually as utilities publish new reports.
Embed this map
<a href="https://baristabench.com/data/espresso-water-map">
  <img src="https://baristabench.com/data/espresso-water-map.svg"
       alt="US cities ranked by tap water quality for espresso" />
</a>
Source: Barista Bench, Espresso Water Map, 2026.