Data study
The World Cup of Coffee
If the World Cup were decided by coffee, who lifts the trophy on July 19? We scored all 48 qualified nations on four coffee metrics: how much coffee people drink, how many cafes they have per head, how much coffee the country grows, and what a cappuccino costs relative to local prices. Then we took the actual knockout bracket and played every real fixture as a coffee matchup. The better coffee nation advances. No penalties, no VAR, just beans.
The result
Spain wins the World Cup of Coffee with a Coffee World Ranking of 39.9 out of 100. Scroll down for the full bracket, every matchup, and the complete 48-nation table. Journalists: the dataset and graphics are free to use with attribution and a link.
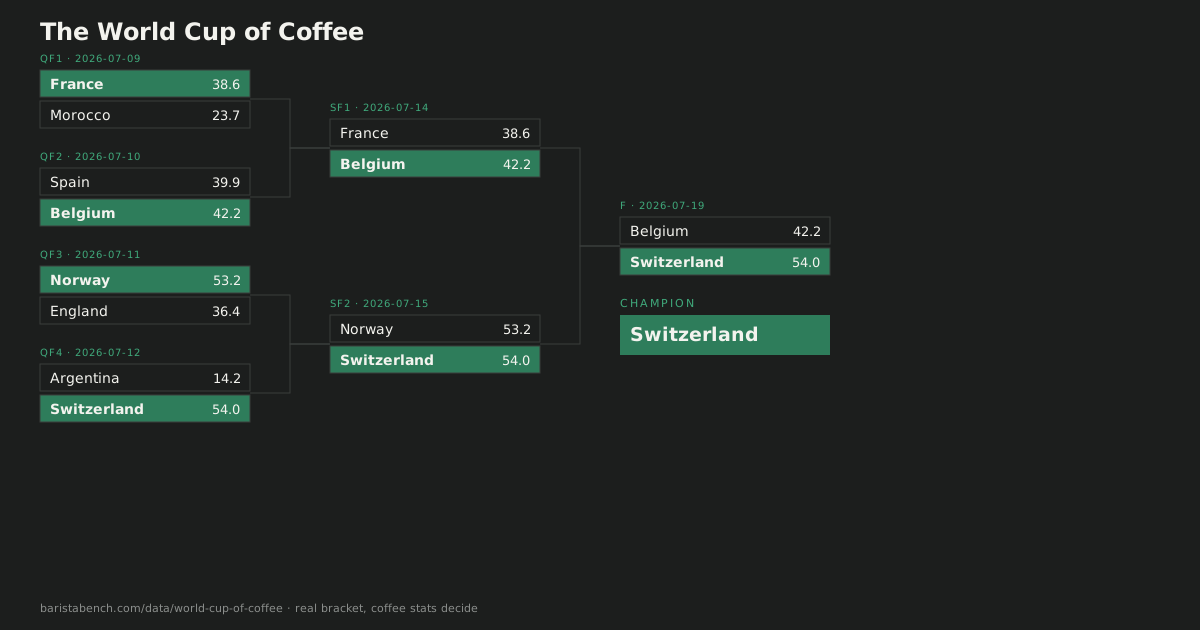
Every matchup, called by coffee
Round of 16, still to be played when we ran the numbers
Argentina 14.2 · Egypt 5.2Argentina advances
A cappuccino runs $3.52 in Argentina against $1.56 in Egypt. Coffee World Ranking: 14.2 to 5.2.
Reality check: Argentina won the real match. Coffee called it.
Switzerland 54.0 · Colombia 36.4Switzerland advances
Switzerland drinks 8.8 kg of coffee per person per year to Colombia's 2.6 kg. Coffee World Ranking: 54.0 to 36.4.
Reality check: Switzerland won the real match. Coffee called it.
Quarterfinals
France 38.6 · Morocco 23.7France advances
France drinks 5.5 kg of coffee per person per year to Morocco's 1.7 kg. Coffee World Ranking: 38.6 to 23.7.
Reality check: France won the real match. Coffee called it.
Spain 39.9 · Belgium 42.2Belgium advances
Belgium drinks 6.2 kg of coffee per person per year to Spain's 4.1 kg. Coffee World Ranking: 39.9 to 42.2.
Reality check: Spain won the real match. Football disagrees with coffee.
Norway 53.2 · England 36.4Norway advances
Norway drinks 8.8 kg of coffee per person per year to England's 3.8 kg. Coffee World Ranking: 53.2 to 36.4.
Reality check: England won the real match. Football disagrees with coffee.
Argentina 14.2 · Switzerland 54.0Switzerland advances
Switzerland drinks 8.8 kg of coffee per person per year to Argentina's 1.1 kg. Coffee World Ranking: 14.2 to 54.0.
Reality check: Argentina won the real match. Football disagrees with coffee.
Semifinals
France 38.6 · Spain 39.9Spain advances
Spain has 49 mapped cafes per 100,000 people to France's 25. Coffee World Ranking: 38.6 to 39.9.
Reality check: Spain won the real match. Coffee called it.
England 36.4 · Argentina 14.2England advances
England drinks 3.8 kg of coffee per person per year to Argentina's 1.1 kg. Coffee World Ranking: 36.4 to 14.2.
Reality check: Argentina won the real match. Football disagrees with coffee.
Third place playoff
France 38.6 · England 36.4France takes bronze
France drinks 5.5 kg of coffee per person per year to England's 3.8 kg. Coffee World Ranking: 38.6 to 36.4.
Reality check: England won the real match. Football disagrees with coffee.
The final
Spain 39.9 · Argentina 14.2Spain lifts the trophy
Spain drinks 4.1 kg of coffee per person per year to Argentina's 1.1 kg. Coffee World Ranking: 39.9 to 14.2.
Reality check: Spain won the real match. Coffee called it.
The coffee top 10
The full ranking of all 48 qualified nations is in the table below and in the downloadable dataset.
| # | Nation | Score | kg/person/yr | World Cup fate |
|---|---|---|---|---|
| 1 | Portugal | 60.4 | 5.4 | out in the round of 16 |
| 2 | Sweden | 58.9 | 10.3 | eliminated |
| 3 | Croatia | 58.5 | 5.8 | eliminated |
| 4 | Brazil | 57.8 | 6.3 | out in the round of 16 |
| 5 | Switzerland | 54.0 | 8.8 | out in the quarterfinals |
| 6 | Norway | 53.2 | 8.8 | out in the quarterfinals |
| 7 | Austria | 52.5 | 7.9 | eliminated |
| 8 | New Zealand | 50.7 | 5.8 | eliminated |
| 9 | Canada | 50.4 | 7.8 | out in the round of 16 |
| 10 | Bosnia and Herzegovina | 47.5 | 5.7 | eliminated |
All 48 nations
| # | Nation | Score | Consumption kg | Cafes /100k | Production (k bags) | Cappuccino USD |
|---|---|---|---|---|---|---|
| 1 | Portugal | 60.4 | 5.4 | 135.2 | · | 2.14 |
| 2 | Sweden | 58.9 | 10.3 | 39.5 | · | 4.83 |
| 3 | Croatia | 58.5 | 5.8 | 135.1 | · | 2.55 |
| 4 | Brazil | 57.8 | 6.3 | 1.9 | 63,000 | 2.03 |
| 5 | Switzerland | 54.0 | 8.8 | 42.6 | · | 6.30 |
| 6 | Norway | 53.2 | 8.8 | 45.3 | · | 5.38 |
| 7 | Austria | 52.5 | 7.9 | 59.4 | · | 4.73 |
| 8 | New Zealand | 50.7 | 5.8 | 69.2 | · | 3.35 |
| 9 | Canada | 50.4 | 7.8 | 30.5 | · | 3.74 |
| 10 | Bosnia and Herzegovina | 47.5 | 5.7 | 64.0 | · | 1.69 |
| 11 | Australia | 47.2 | 5.9 | 56.0 | · | 3.90 |
| 12 | Netherlands | 46.2 | 7.0 | 35.1 | · | 4.27 |
| 13 | Germany | 44.0 | 6.3 | 40.7 | · | 4.13 |
| 14 | Belgium | 42.2 | 6.2 | 32.9 | · | 4.22 |
| 15 | Spain | 39.9 | 4.1 | 49.2 | · | 2.43 |
| 16 | France | 38.6 | 5.5 | 25.2 | · | 3.93 |
| 17 | Czechia | 37.0 | 4.7 | 37.9 | · | 3.24 |
| 18 | Scotland | 36.4 | 3.8 | 57.5 | · | 4.79 |
| 19 | England | 36.4 | 3.8 | 57.5 | · | 4.79 |
| 20 | Colombia | 36.4 | 2.6 | 7.8 | 13,800 | 2.10 |
| 21 | USA | 36.2 | 4.7 | 15.2 | 50 | 5.43 |
| 22 | Korea Republic | 32.0 | 3.9 | 24.8 | · | 3.41 |
| 23 | Tunisia | 30.8 | 2.6 | 25.5 | · | 0.96 |
| 24 | Japan | 30.6 | 3.2 | 22.8 | · | 3.08 |
| 25 | Algeria | 30.0 | 2.7 | 10.0 | · | 0.84 |
| 26 | Mexico | 27.4 | 1.4 | 4.0 | 3,903 | 3.75 |
| 27 | Jordan | 26.5 | 5.0 | 3.9 | · | 3.63 |
| 28 | Ecuador | 24.4 | 1.3 | 11.6 | 350 | 2.58 |
| 29 | Morocco | 23.7 | 1.7 | 16.6 | · | 1.70 |
| 30 | Panama | 20.5 | 2.3 | 8.0 | 80 | 3.90 |
| 31 | Saudi Arabia | 19.9 | 2.7 | 3.7 | · | 3.62 |
| 32 | Iraq3/4 | 19.0 | · | 7.1 | · | 2.65 |
| 33 | Haiti3/4 | 17.5 | 1.9 | 1.6 | 346.6 | · |
| 34 | Uzbekistan3/4 | 14.3 | · | 9.4 | · | 2.09 |
| 35 | Argentina | 14.2 | 1.1 | 10.4 | · | 3.52 |
| 36 | South Africa | 14.2 | 0.7 | 2.4 | · | 2.34 |
| 37 | Uruguay | 14.0 | 0.6 | 6.7 | · | 4.25 |
| 38 | Cote d'Ivoire3/4 | 13.1 | 0.1 | 5.4 | 1,300 | · |
| 39 | Qatar3/4 | 12.5 | · | 10.5 | · | 5.41 |
| 40 | Turkiye | 7.5 | 1.2 | 15.2 | · | 3.55 |
| 41 | Congo DR3/4 | 7.0 | 0.1 | 0.1 | 200 | · |
| 42 | Egypt | 5.2 | 0.5 | 1.3 | · | 1.56 |
| 43 | Cabo Verde2/4 | 5.2 | · | 12.2 | · | · |
| 44 | Iran3/4 | 3.9 | 0.6 | 4.8 | · | · |
| 45 | Paraguay3/4 | 2.3 | 0.2 | 2.8 | 20 | · |
| 46 | Senegal3/4 | 0.2 | 0.0 | 0.5 | · | · |
| 47 | Ghana3/4 | 0.1 | 0.0 | 0.4 | 14.5 | · |
| 48 | Curacao2/4 | 0.0 | · | 0.0 | · | · |
· means no data from our sources for that nation and metric. Those nations are scored on the metrics they have (weights renormalize).
How we did this
Four metrics, weighted: coffee consumption per person (35 percent, USDA and ICO), mapped cafes per 100,000 people (20 percent, OpenStreetMap), green coffee production (15 percent, USDA and ICO), and cappuccino price (15 percent, Numbeo). Each is normalized to 100 across the field, and every number carries its source and year in the dataset. A planned Google Trends metric was dropped because Google blocks programmatic access. We would rather drop a metric than invent one.
This is the playful sibling of our data work, and we say so openly: OpenStreetMap coverage varies by country, Numbeo is crowd-sourced, and the EU consumption figures are the latest the ICO publishes per country. Every judgment call is written up in the full methodology. Fact-checking a number? Email hello@baristabench.com. We answer.
Download the full dataset (CSV) with per-value sources, or grab the bracket graphic. Both are free to publish with attribution and a link to this page.
While you are here: we review espresso machines with the same honesty. Start with the best espresso machines for home or every review we have published.